5 min audio
Interview prep has a strange failure mode.
You can solve the problem, pass the sample testcase, and still not feel like you understand the solution deeply enough to explain it in an interview.
That gap usually shows up when someone asks:
- Why did this pointer move?
- What changed in the hash map?
- What is the window covering right now?
- Why did binary search discard that half?
- What is the stack doing at this line?
The normal way to answer those questions is slow:
- add print statements
- rerun the code
- mentally connect each print to the current line
- remove the print statements
- repeat when the next testcase behaves differently
I wanted something faster than that.
So I built a LeetCode Solution Visualizer.
What the visualizer does
The app lets you paste a Python LeetCode-style solution, provide a testcase, and run the code directly in the browser.
Instead of only showing the final answer, it records the execution trace:
- current line
- changed variables
- arrays and lists
- maps and dictionaries
- sets
- scalar values
- return value
- expected-output match
Then it lets you step through the solution like a debugger, but with a layout focused on algorithm understanding instead of general-purpose debugging.
The goal is not to replace solving problems.
The goal is to shorten the time between “my code passed” and “I can explain exactly why it passed.”
The problem with raw traces
The first version showed every executed line.
That was technically correct, but not very useful.
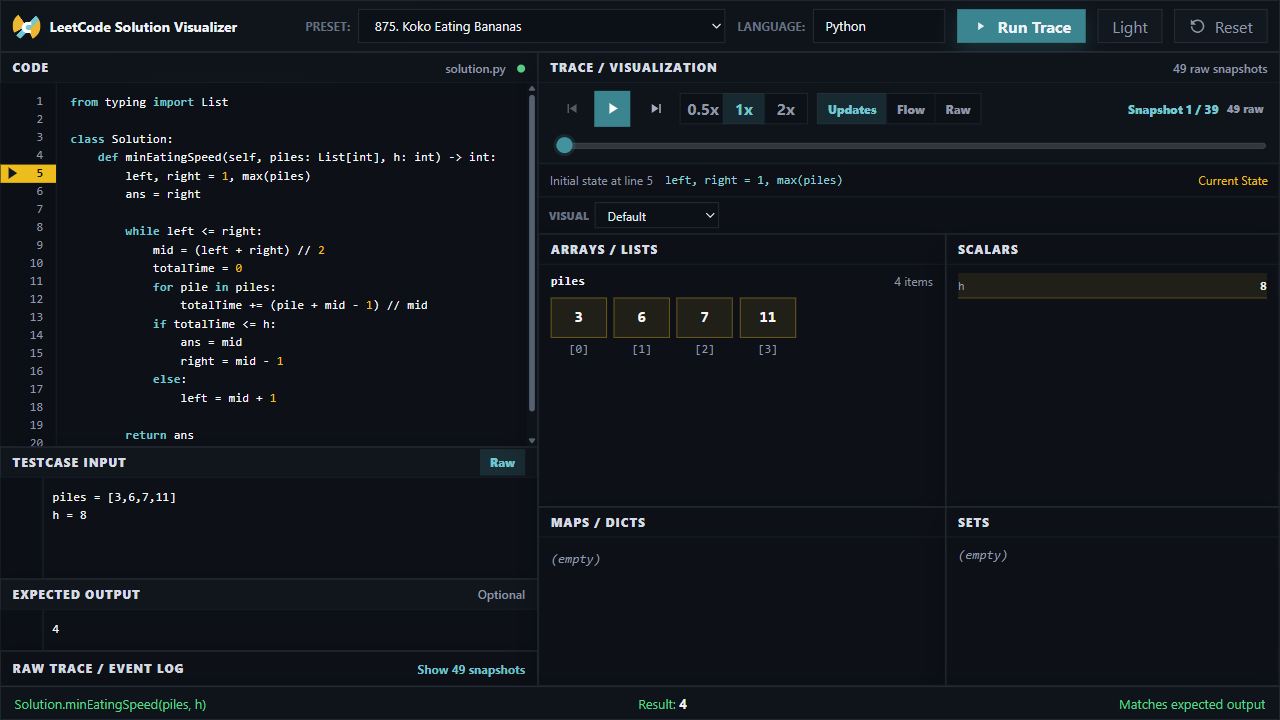
For a small binary-search problem like Koko Eating Bananas, a normal execution can produce dozens of snapshots because every loop condition, repeated for line, and accumulator update becomes a trace event.
That creates a different problem:
- the trace is accurate
- but the learner has to work too hard to find the important changes
So I shifted the UI toward variable and data-structure tracking.
The app still keeps the raw event log, but the default view focuses on state updates. If a variable did not change, it usually does not deserve the same visual weight as a line that changed the algorithm state.
That small decision makes the trace feel much closer to how people explain solutions out loud.
Why this helps in interview preparation
Most interview prep time is not spent writing the final correct code.
A lot of it is spent building intuition:
- understanding why a two-pointer solution works
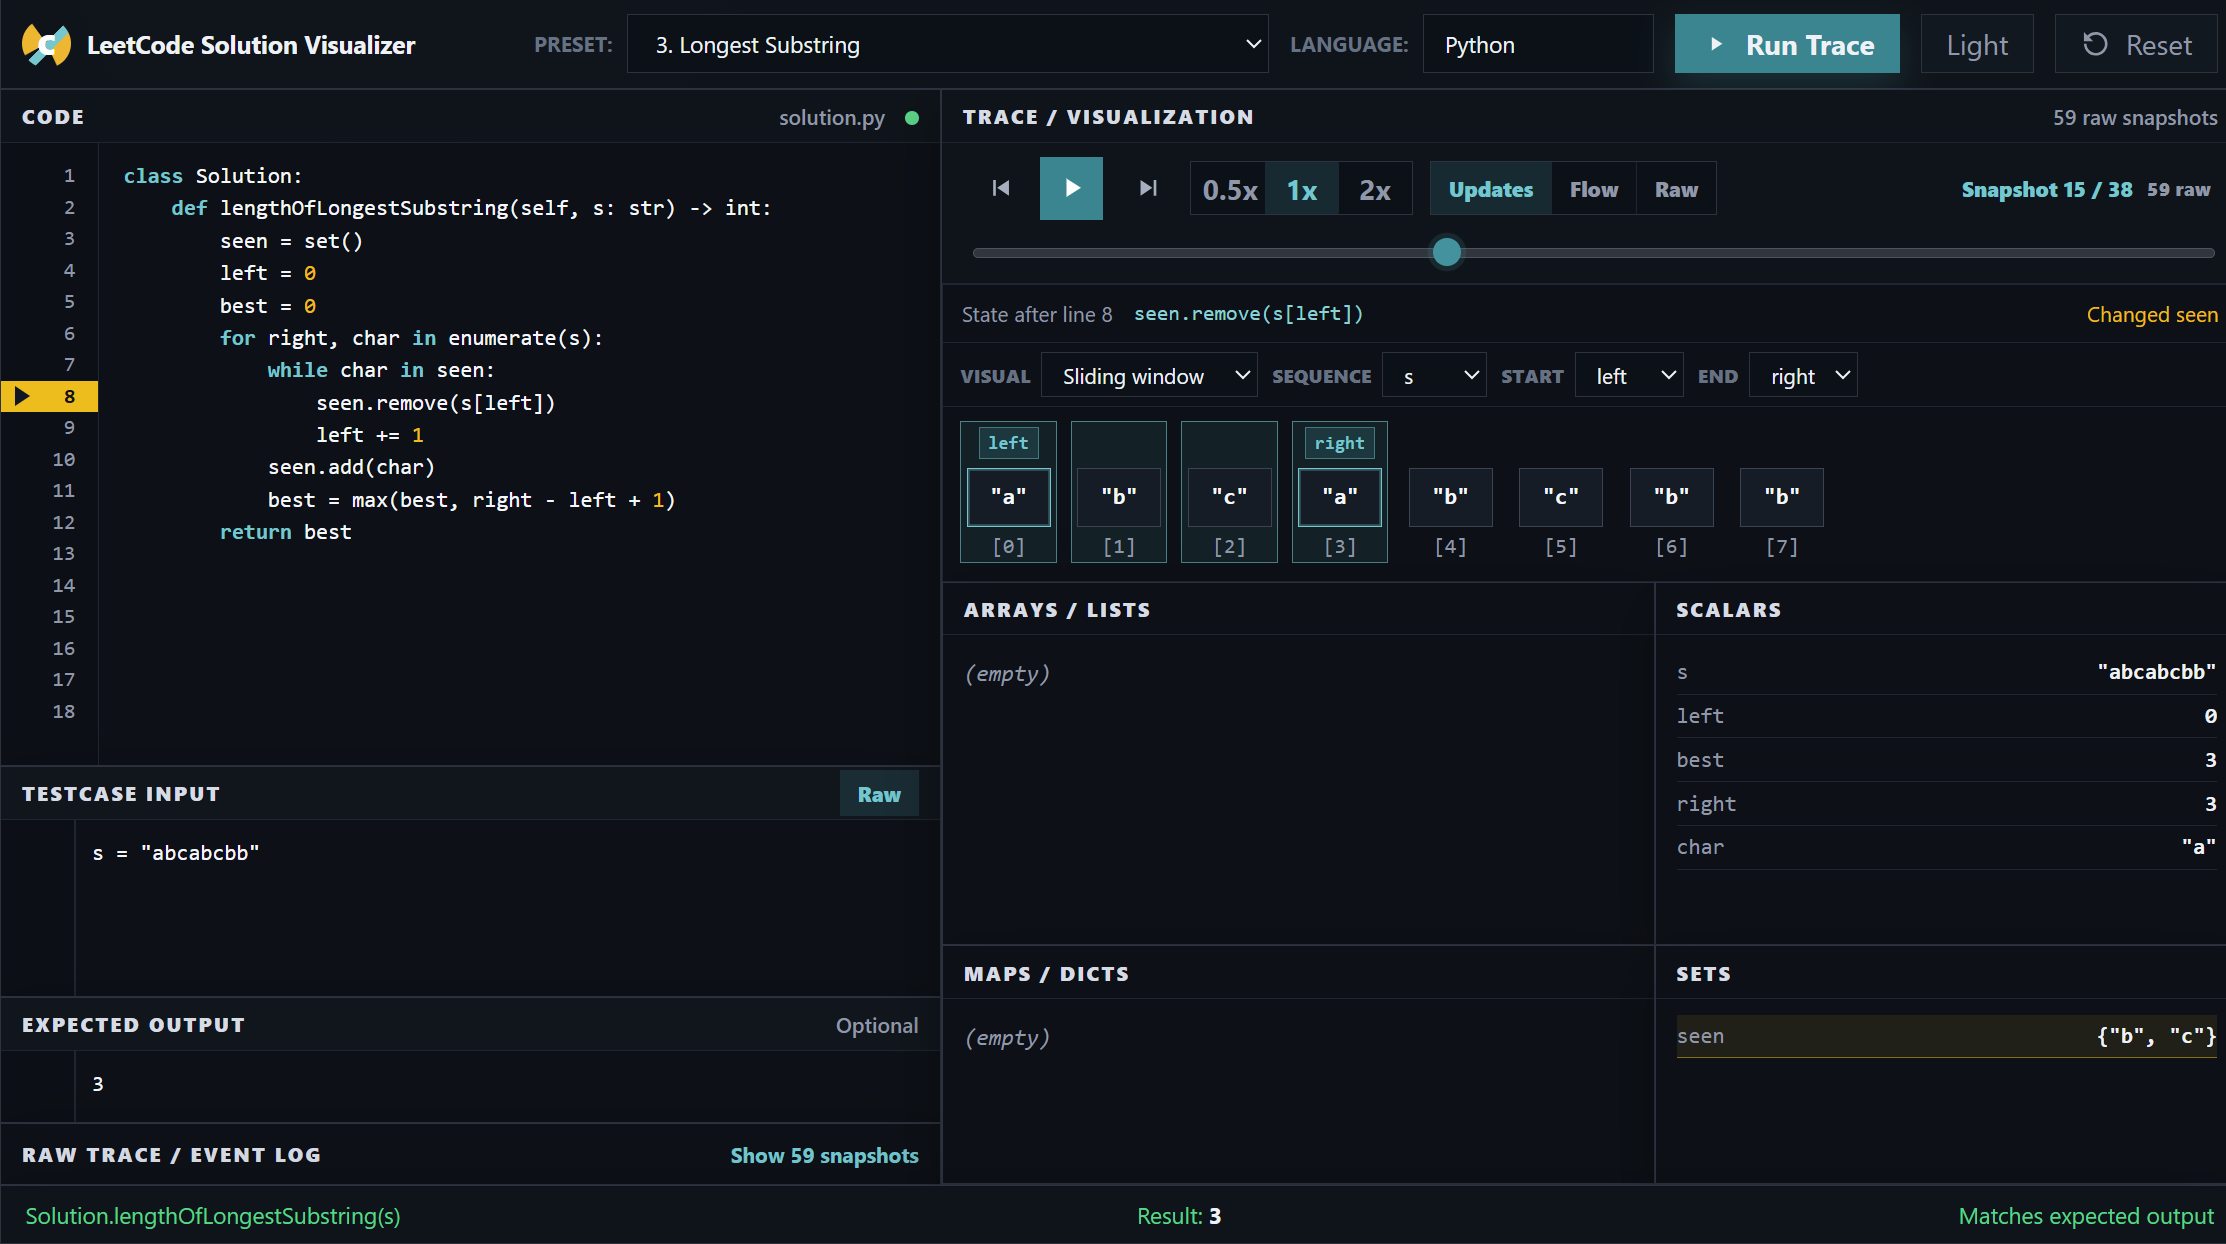
- seeing how a sliding window expands and shrinks
- noticing how a stack represents unmatched state
- confirming that a DP table is being filled in the intended order
- checking edge cases without rewriting the explanation from scratch
This tool makes those states visible.
For example, in a sliding-window problem, seeing left, right, the active window, the set contents, and the current line together is much easier than reconstructing all of that from print output.
That matters because interviews reward explanation, not just code.
If I can replay a solution and watch the state move, I can usually answer the “why” questions much faster.
The time-saving part
The biggest practical win is removing repetitive debugging work.
Without a visualizer, a typical practice loop looks like this:
- Write the solution.
- Add prints for the variables you care about.
- Run one testcase.
- Add more prints because the first ones were not enough.
- Try to map each output line back to the source code.
- Delete the prints.
- Start again for another testcase.
With the visualizer, the loop becomes:
- Write or paste the solution.
- Add the testcase.
- Run trace.
- Step through the state changes.
That saves time, but more importantly, it saves attention.
During interview preparation, attention is the scarce resource. I do not want to spend it formatting print statements or counting which loop iteration produced which output line.
I want to spend it understanding the algorithm.
Why I kept it deterministic
One thing I deliberately avoided was using an LLM to “explain” the trace.
LLMs can be helpful, but this part of the product needs to be exact. If the UI says an array cell is active or a pointer moved, it should be because the runtime state proves it.
So the app uses deterministic tracing and conservative visualization rules:
- direct subscripts like
nums[i]can highlightnums[i] for i in range(len(nums))can highlight the indexed elementenumerate(nums)can connect index and value- unique direct iteration values can be highlighted safely
- ambiguous cases fall back to exact variable display
That last point is important.
A wrong visualization teaches the wrong intuition. It is better to show less and stay correct than to guess too aggressively.
What I learned while building it
The hardest part was not running the Python code.
The harder part was deciding what to hide.
A raw trace gives you everything, but everything is not the same as understanding.
The useful version of this app came from reducing noise:
- show changed variables clearly
- group data structures by type
- keep raw trace available but collapsed
- make playback controls prominent
- avoid large explanation cards
- let users choose visualization modes for pointers, windows, trees, graphs, and DP
That is the difference between a debugger and an interview-prep tool.
A debugger helps you inspect a program.
This app is trying to help you understand an algorithm.
Where it can go next
There are still several features that could make this more useful:
- better recursion visualization
- cleaner tree and graph layouts
- stronger DP table support
- shareable trace URLs
- exporting a trace for notes
- more problem presets
- more precise active-loop and condition context
But even in its current form, it already solves the main pain point I had:
I can take a LeetCode solution, run it with a testcase, and quickly see how the algorithm state changes.
That makes practice less about staring at code and more about building intuition.
Try it out
The visualizer is open-source and runs directly in the browser:
- Live App: LeetCode Solution Visualizer
- GitHub: leetcode-visualizer
Credits
- LeetCode-style interview problems for the examples and workflows this tool is designed around
- Pyodide for making browser-based Python execution possible
- React and Vite for the frontend foundation