3 min audio
Most job search tools answer: “what roles are open right now?”
I wanted a different answer:
“What are companies actually doing—accelerating, freezing, or quietly shifting—and what should I do about it this week?”
So I built a small tool for myself: a Hiring Trend Tracker that watches hiring activity across dozens of companies, then turns it into signals that help with:
- timing (when to apply vs when to network),
- momentum (booming vs freezing vs stable),
- durability (how long roles typically stay open),
- and context (news that explains spikes and slowdowns).
Why I stopped obsessing over individual roles
Job boards already do role search extremely well.
But they don’t tell you:
- whether a company is ramping up or cooling down,
- whether jobs close fast (48h urgency) or stay open for weeks (networking-first),
- whether this week is an “apply week” or a “relationship week,”
- and whether a headline actually correlates with real hiring movement.
That’s the gap this project tries to fill.
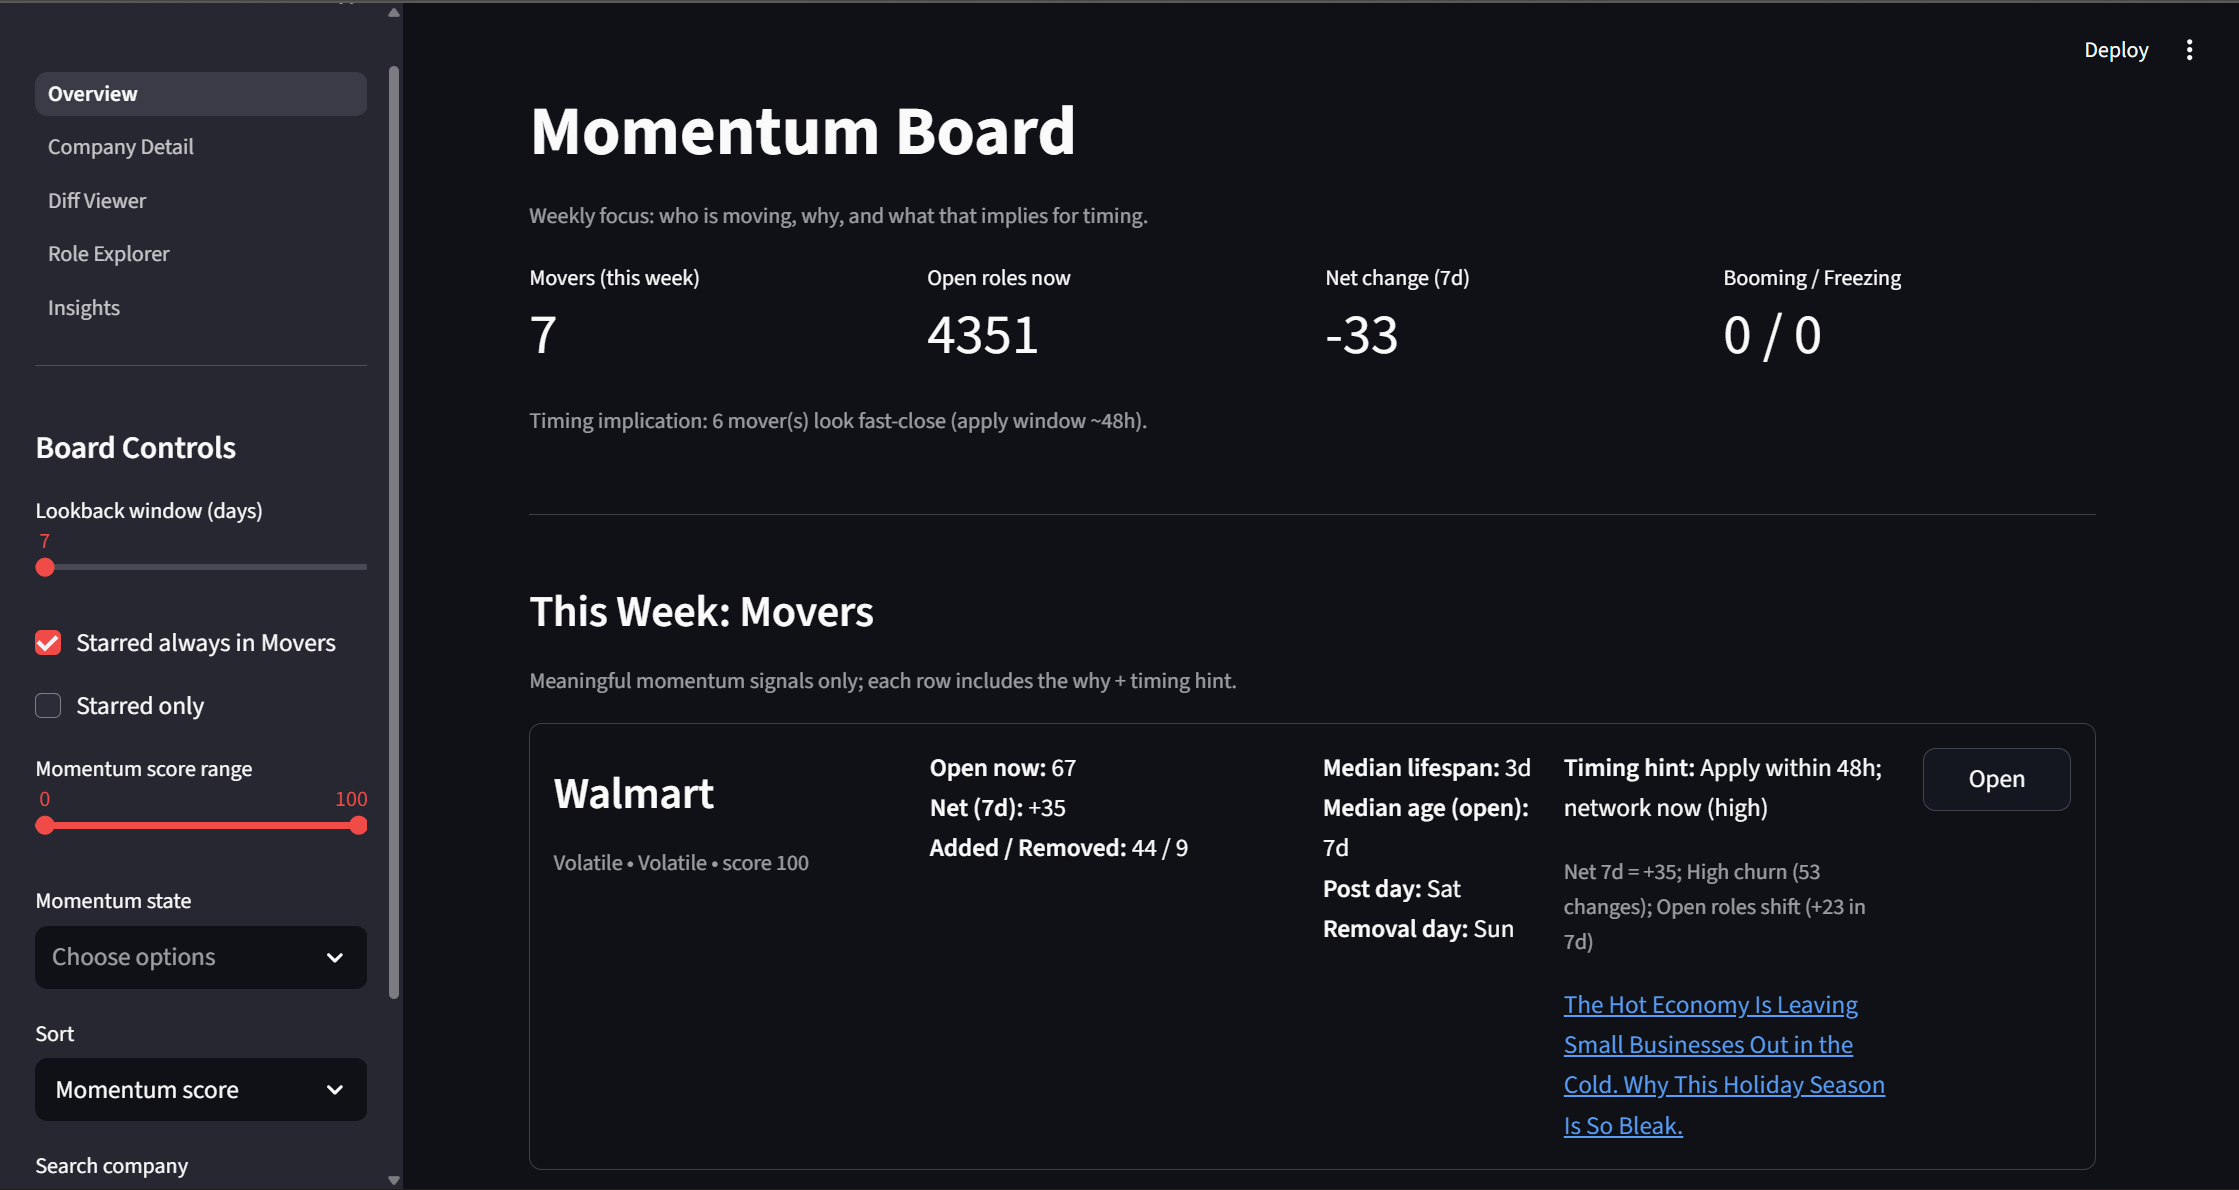
The Momentum Board: attention without missing anyone
Tracking 78+ companies is overwhelming if everything looks equally important.
So the dashboard is intentionally split into two sections:
1) This Week: Movers
Only companies with meaningful weekly signals get expanded:
- accelerating / volatile churn / freezing signals
- a short “why” statement
- a timing hint
2) All Others (collapsed but still present)
Everyone else is still visible—just collapsed by default. You can expand the Stable/Quiet groups anytime.
This keeps the dashboard usable daily without hiding companies.
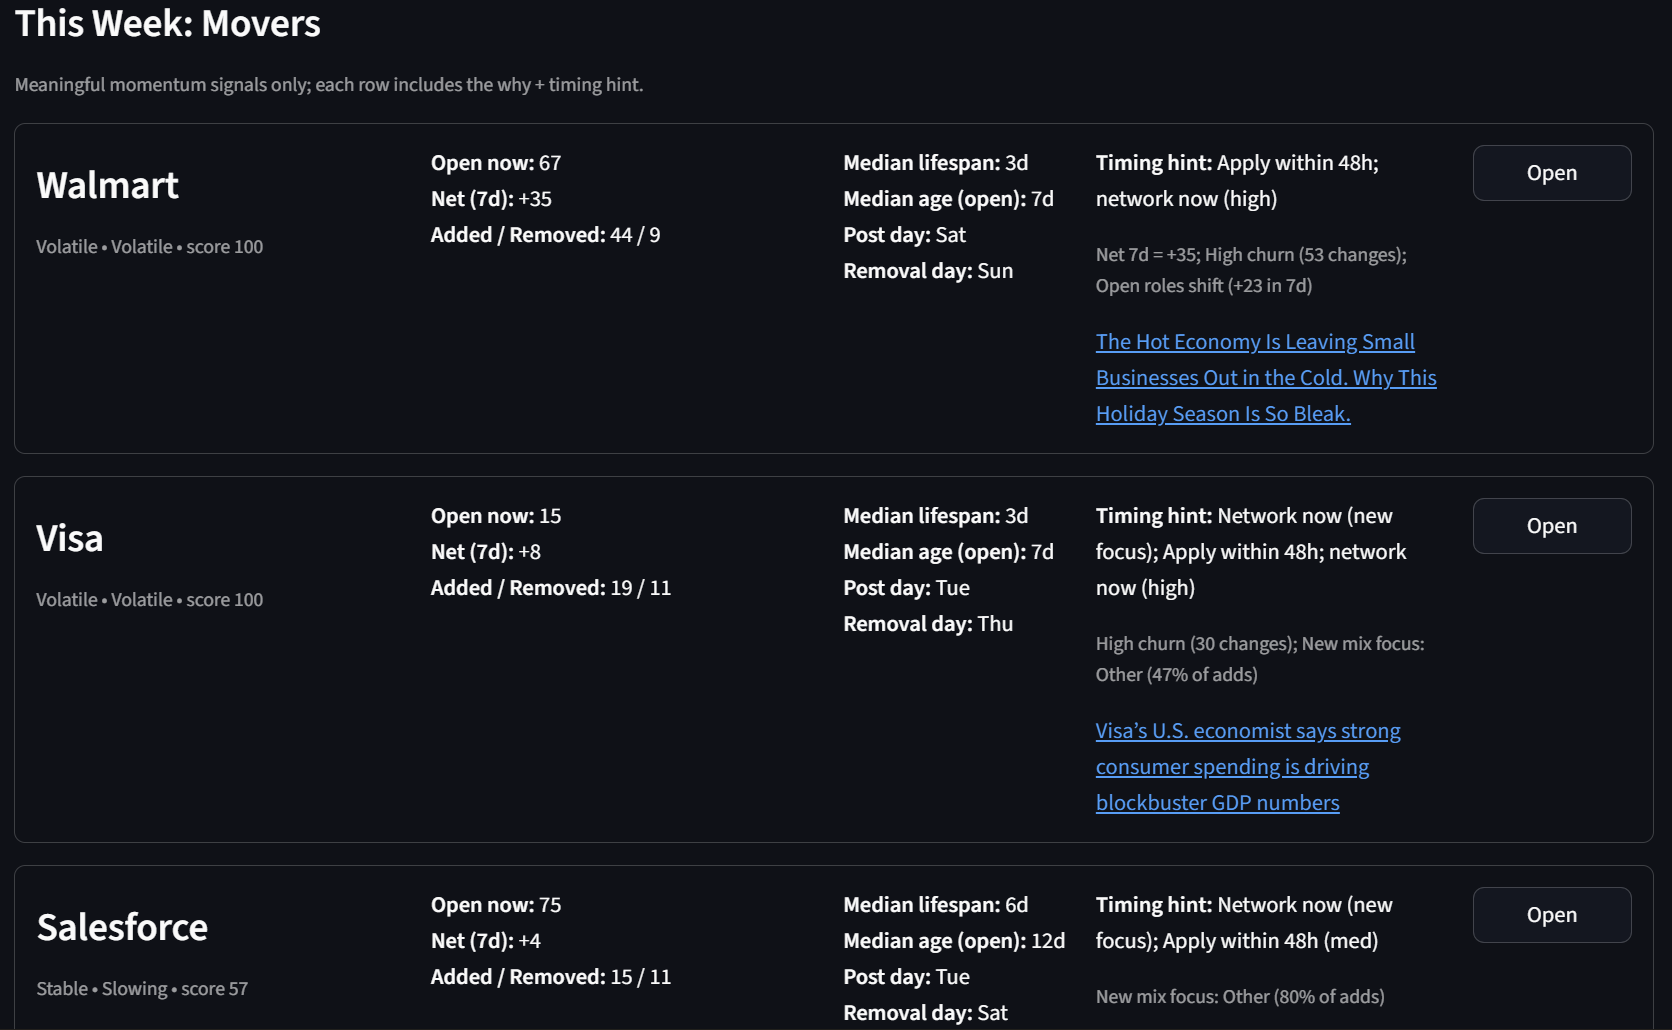 Figure: Movers are expanded; everyone else stays visible but collapsed.
What “momentum” means (in human terms)
Momentum here is not a buzzword. It’s just:
what changed this week vs last week, and how consistently it’s changing.
A company might be:
- Booming: sustained adds, open roles trending up
- Freezing: removals dominate, open roles trending down
- Volatile: lots of adds/removes (churn), unclear direction
- Stable: low movement
And each label includes a simple explanation:
- “Net +X in 7d”
- “Removals spike”
- “High churn”
- “Open roles shifted sharply”
Job lifespan: the most practical signal I didn’t expect
One insight changed how I behave immediately:
How long jobs last at a company.
If most postings disappear quickly, the right move is speed. If postings linger, the right move is networking and targeting.
So for each company I compute:
- median days a role stays open
- percent of roles that close in <7 days
- age buckets (0–3 / 4–7 / 8–14 / 15–30 / 30+)
This turns “job search” into timing strategy.
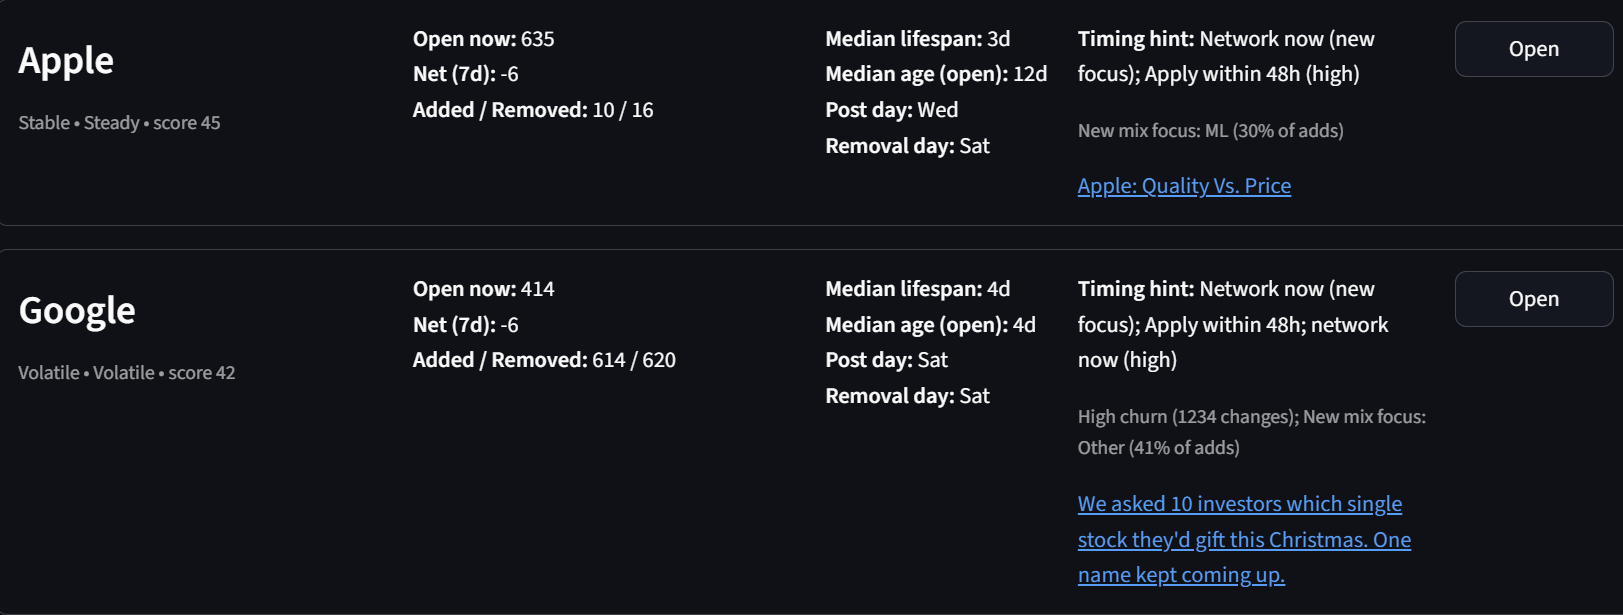 Figure: Roles don’t last equally long across companies; durability changes your strategy.
Timing Intelligence: when to apply vs when to network
Some companies post new roles on predictable weekdays. Some remove roles in predictable bursts.
So the tracker surfaces:
- best weekday for posting
- best weekday for removals
- a confidence score (do we have enough history?)
The output is intentionally simple:
- “Apply within 48h”
- “Apply within 3–5 days”
- “Networking-first (new focus / freeze risk)”
News + hiring trends: only when it explains a signal
News is overwhelming when it’s a feed.
Instead, I only show it when:
- it aligns with a hiring spike,
- it explains removals/freezing behavior,
- or it coincides with a role-mix shift.
So the “news” section becomes: context, not noise.
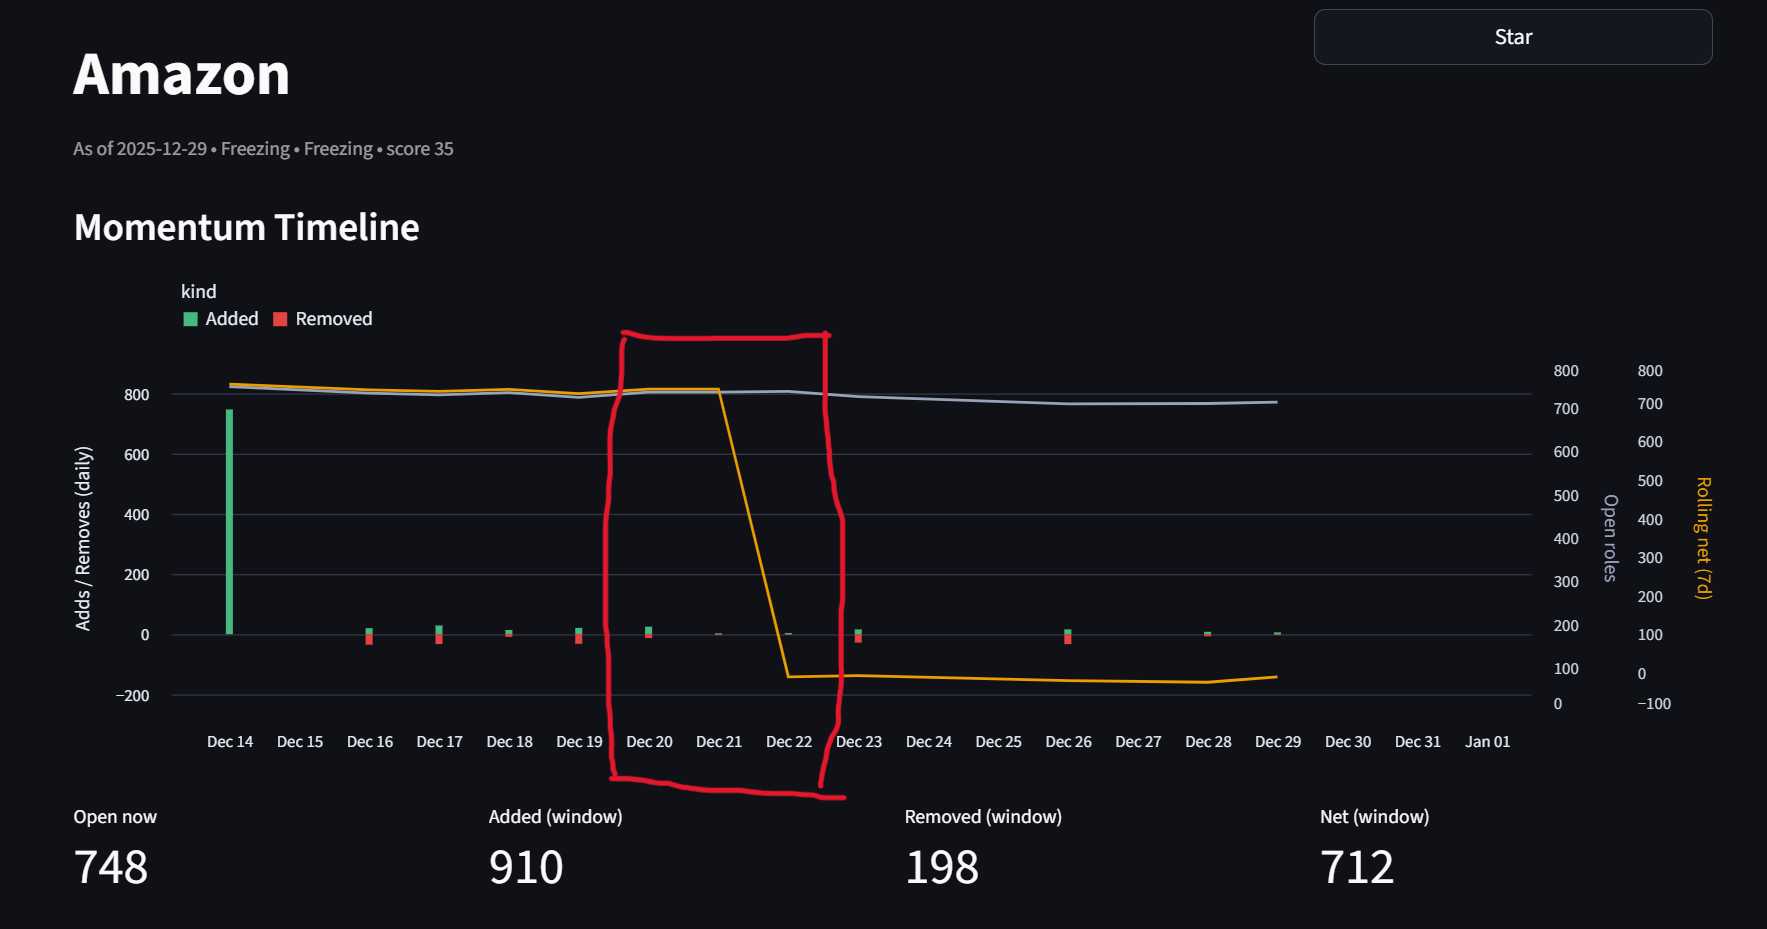
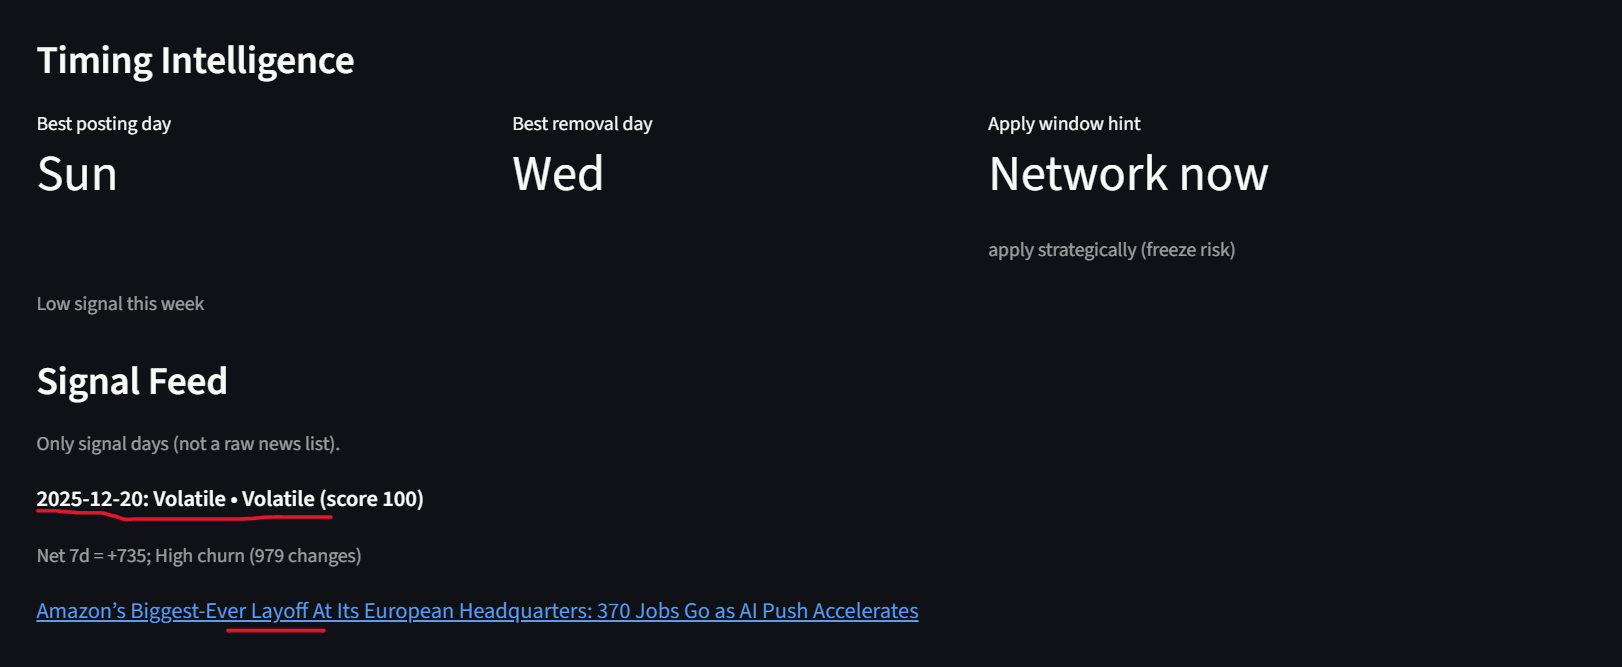 Figure: News can predict hiring trends and explain hiring behavior.
If you want to try it
I’ve open-sourced the project here:
GitHub: Repo link
Setup instructions are already included in the repository.
Closing thought
A job search gets less stressful when you stop treating it like a lottery and start treating it like a market:
- watch momentum,
- understand timing,
- and move when signals are real.
That’s what I’m building for.